SpaceX Falcon 9 Booster Recovery
Project Overview
SpaceX has developed the Falcon 9 rocket which can reduce the cost of each launch by being able to recover and reuse its first stage booster. I looked at data from SpaceX and Wikipedia to determine if features of these launches could be use to predict if a booster would successfully land. This project was the capstone for my Data Science Professional Certificate from IBM. The details of this project can be seen below. Each section of the project contains a link to the section’s github file.
Data Wrangling and Cleaning
In the first part of the project I first used Python and a REST API to get the required data from SpaceX. I then parsed the data into a Pandas dataFrame, using a REST API again to convert various ID numbers to more useable information. Some of the features contained lists which needed to be parsed into separate features to become more useful. The resulting DataFrame was then filtered to only include Falcon 9 rockets. Date and time was reformatted to only include dates. Finally, null values in the payloadmass feature were replaced with the feature mean value.
Skills used:
Python, Pandas, REST API

Image courtesy of Pexels.com and ThisisEngineering

Image courtesy of Pexels.com and Pixabay
Web Scrapping
The next step of this project was to show my knowledge of web scrapping using the BeautifulSoup Library in Python. For this I created a get request from Wikipedia’s webpage on SpaceX Falcon 9 launches. I then created a BeautifulSoup object from this request. Next, the BeautifulSoup object was parsed into a dictionary to extract the data wanted for the project. Finally, this dictionary were used to create a Pandas DataFrame.
Skills used:
Python, Pandas, BeautifulSoup
Exploratory Data Analysis with SQL
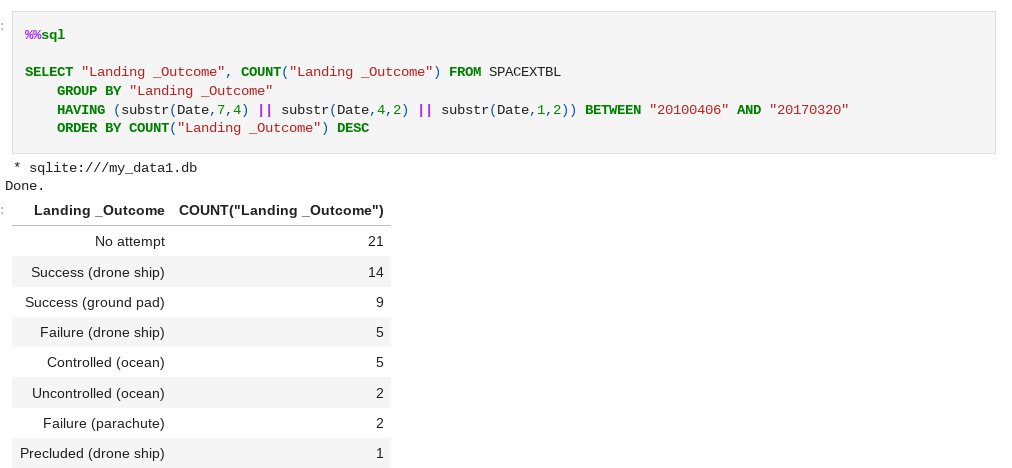
In this part of the project I used SQL to perform a series of queries to pull information I could use later on. The queries that provided the most help going forward was the maximum payload amount, the distinct launchpads used, and the total time each type of successful landing occurred. This information was used during the creation of the project’s dashboard.
Skills used:
SQL
Exploratory Data Analysis with Folium
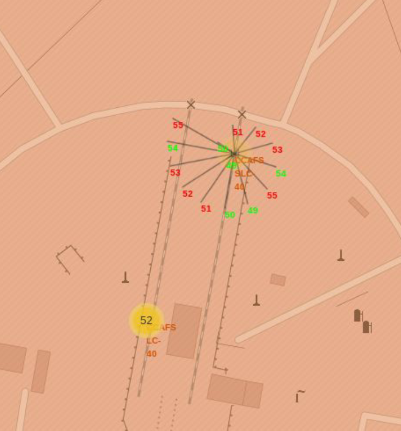
Here I used the Folium library in Python to create geographical visualizations of the falcon 9 launches. First, I created markers to show where the launch sites were located. I then created markers and marker clusters to visualize the success and failure of the rocket first stage landings from each launch site. Finally, I marked out distances from the launch sites to important features such as the coast and railways
Skills used:
Python, Pandas, Folium
Exploratory Data Analysis with Visualization
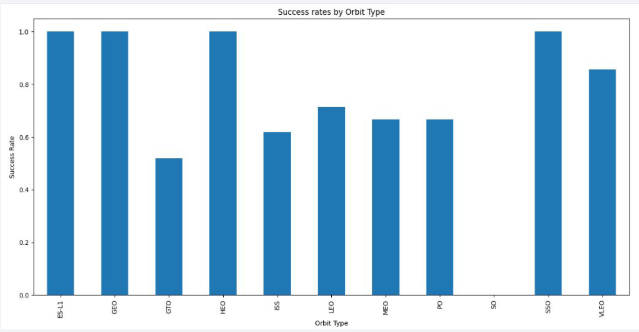
In this part of the project I looked at the relationships of features compared to the success and failure of the first stage landing. I used the MatPlotLib and Seaborn library in Python to create visualizations. I created scatterplots, bar graphs, and line graphs to decide which features could be used in my prediction models. The most promising features turned out to be payload mass, flight number, orbit type, and launch site. After the visualizations, I used one hot encoding to prepare the data for the machine learning models used later in the project.
Skills used:
Python, Pandas, MatPlotLib, Seaborn
Dashboard Creation
This part of the project had me creating a dashboard using Plotly and Dash libraries in Python. I created a Dash application where I first laid out the structure of the visualizations and controls. I then added a drop down menu so I could look at each individual launch sites success rates for first stage landing or compare them all together. I also created a slider so the payload mass of the missions could be restricted. After the controls were in place I created wrappers and functions to filter the data and display the pie chart and scatter plot requested through the controls.
Skills used:
Python, Pandas, Plotly, Dash
Machine Learning Prediction Models
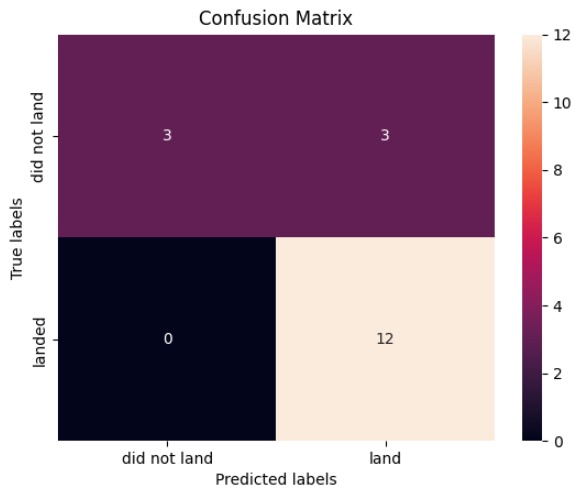
In this part of the project, I created and analyzed learning models to predict if the first stage of a Falcon 9 rocket launch would be successfully recovered. To do this I first formatted and standardized the data using StandardScalar. The data was then split into training and testing sets. Logistic Regression, a Support Vector Machine, a decision tree, and K-Nearest Neighbors models were created and tested. These models’ parameters were optimized using GridSearchCV. Finally, the models were compared using accuracy scores and confusion matrices.
Skills used:
Python, Pandas, Scikit-Learn
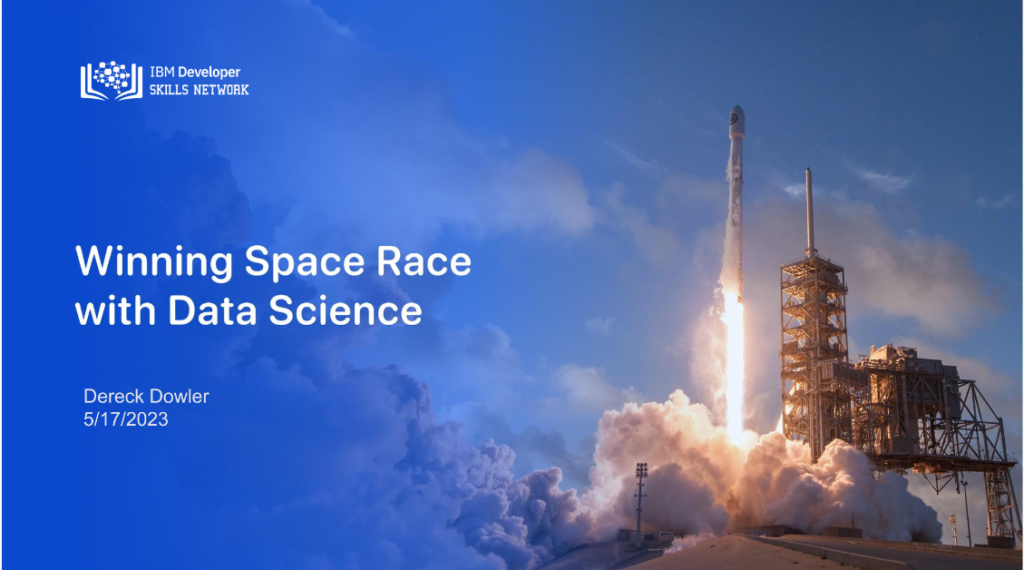
Final Report
The last step of the project was to compile all the projects procedures and results into a final report. This was created in a slide show format and then converted into a pdf. All methodologies and results are recorded in this report.
